Panda Banker Analysis Part 1
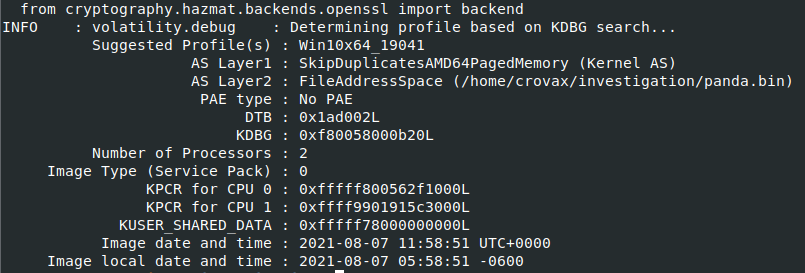
Getting the suggested OS profile
Command: vol.py -f imageinfo

Now we have the proper OS profile to use for the rest of this analysis, we can go on to analyze other areas of interest ( network, processes etc.).
Viewing running processes
Command: vol.py -f pslist

Viewing the list of running processes, we can quickly see one that stands out. Data_1.exe with a process ID of 3816 and a Parent Process ID of 1960. We’ll want view the PP ( Parent Proces) to see what process spawned Data_1.exe.
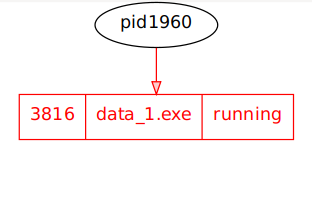
Graph view of the running processes.
Command: vol.py -f --profile=< profile > psscan --output=dot --output-file=< filename >.dot

we can see there is no process name associated to pid 1960, which suggests the process executed then terminated. So well have to tailor our analysis solely around data_1.exe
Viewing the dll’s
Command vol.py -f < memory_file > –profile=< profile > dlllist -p < pid >

from the ouput we can see what dll’s were loaded and where our executable was loaded from. This will be important when trying to locate additional files that may have been dropped or malicious dll’s imported.
Associated handles
Command: vol.py -f < memory_file > –profile=< profile > handles -p < pid > -T Files,Keys,Mutant

Based on the output we can see some interesting associations to the appdata\roaming directory (not a suprise) plus some suspicious looking mutex.
Dumping the malicious process
Command: vol.py -f --profile=< profile > procdump -p < pid > -D .

Once we have a good determination the process is malicious, we want to dump the process and perform some additional analysis (OSINT, Reverse Engineer etc.) which well do in the part 2 of this series
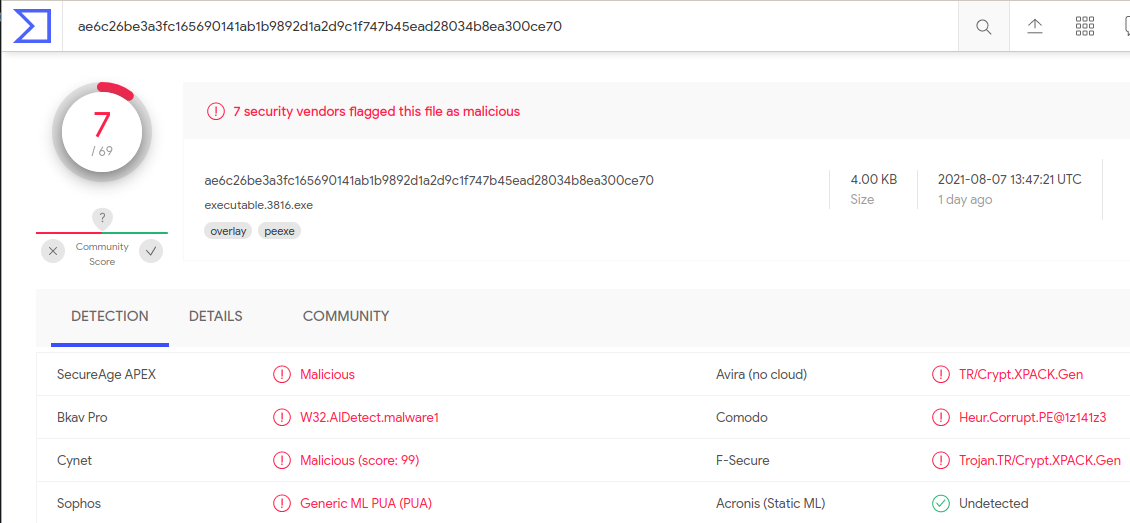
Virustotal Results

To note, the hash in memory and the hash of the original binary will most likely be different, which was the case for me. I had to first upload the binary I dumped from memory and then upload it to Virustotal.
Parsing the Master File Table
Command: vol.py -f --profile=< profile > mftparser --output=text --output-file=< filename >.text

Being able to dump and parse the MFT of the system will help gain further insight into the activities of the binary. Simply, grepping the output of the mft result’s using the process name, we can see the full path from where the process is being executed from.
The next steps if you wanted to dig a bit deeper, would be to grep the file path of the data_1 executable to see if there were any other files dropped (hint….hint).
Summary
By using volatility, we were able to locate the malicious process running on the system. We were able to determine the original executable terminated itself right after spawning data_1.exe. This gives us better insight into the behavior of Panda banker and its functionality. By using different plugins, we were able to to determine the directory path of the process, mutex creations and we were able to dump the process to identify that it was malicious.
In part two of this series, were going to perform some behaviorial and static analysis to see if we can uncover any new functionality that we may have missed or were unable to see. But remember…. Don’t expect much, as I have no clue what I’m doing
